Prices are down six percent since spring. Prices are also up four percent from last year. Both are true, and the people who only see one of them are the ones who are going to get hurt this fall.
I got the same call three times last week, and it was some version of the same question: is the real estate market crashing?
I get why. Greater Moncton just posted its slowest August in over a decade. Inventory is the highest it has been in seven years. Prices are down six percent since spring. If you only saw those three lines, you would ask me the same thing.
Here is what I told all three of them. Prices are also up four percent from last August. Same index, same homes. What happened this summer is a reset, and I am going to walk you through the numbers that show it.
If you are new here, welcome. I am Cameron Brioux, a REALTOR® here in Greater Moncton, and I put this update out every month so you can make decisions on the actual data instead of a headline. This month I am going to give you the numbers first, then my honest read, then what I would do if it were my money. At the end I will tell you the one number I am watching for September, because that is the one that decides whether this reset holds or keeps sliding.
Quick note before the numbers: real estate moves in cycles, and summer always slows a little. Some of what you are about to see is seasonal. Some of it is a real shift. I will be clear about which is which.
The headline numbers
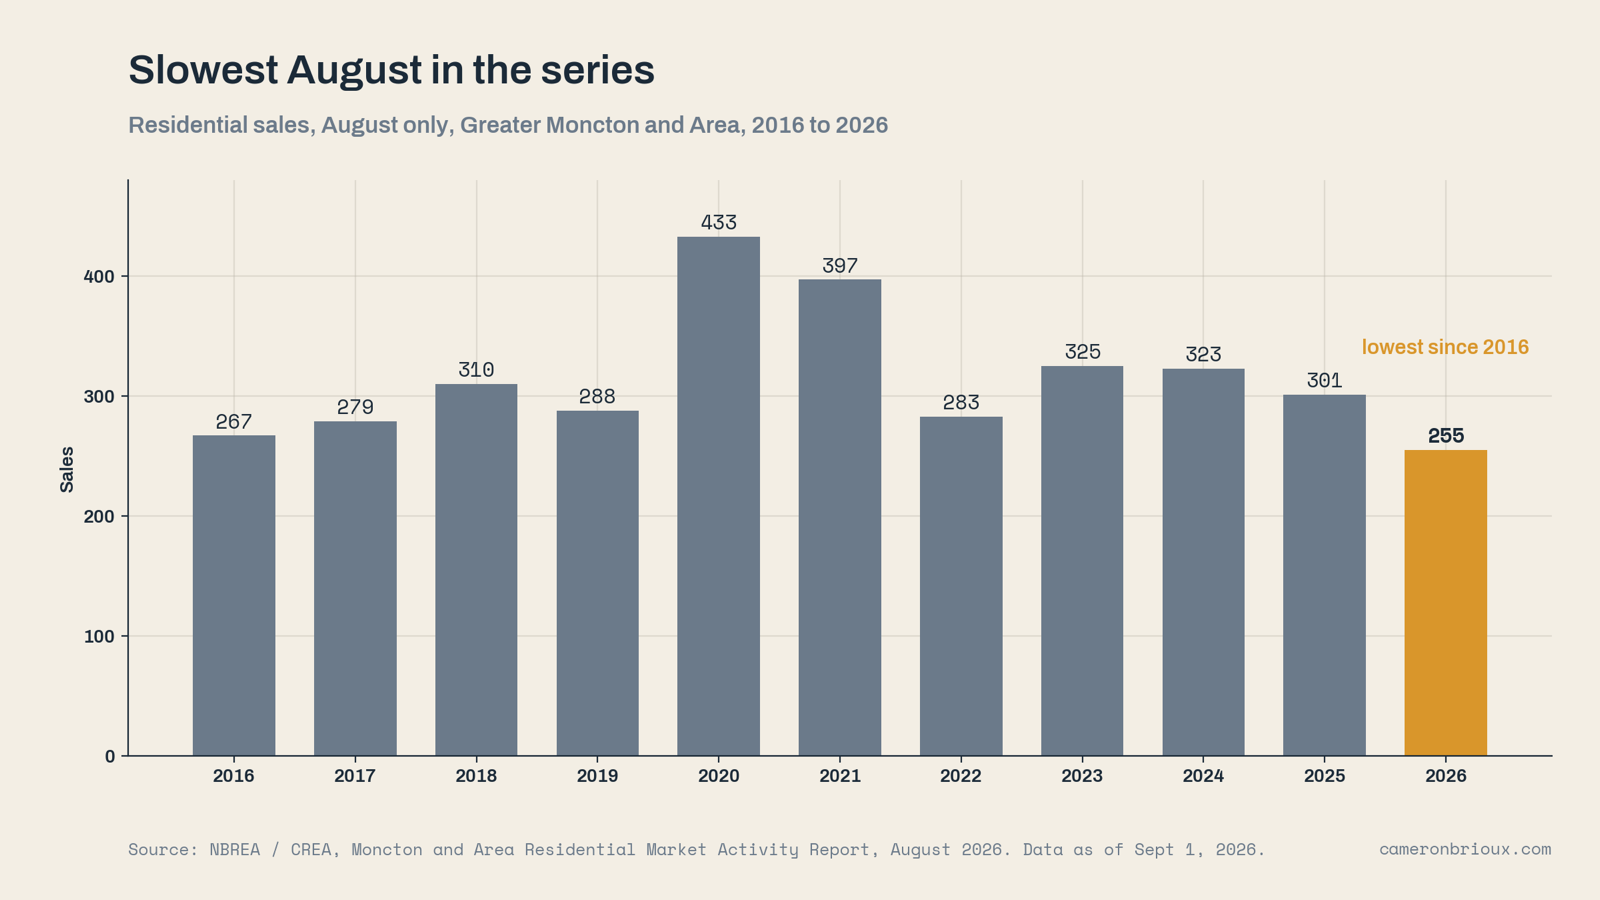
255 homes sold across Greater Moncton and the surrounding area in August. That is down 15 percent from last August, and it is the lowest August total in this report going back to 2016. Lower than 2019. Lower than 2016.
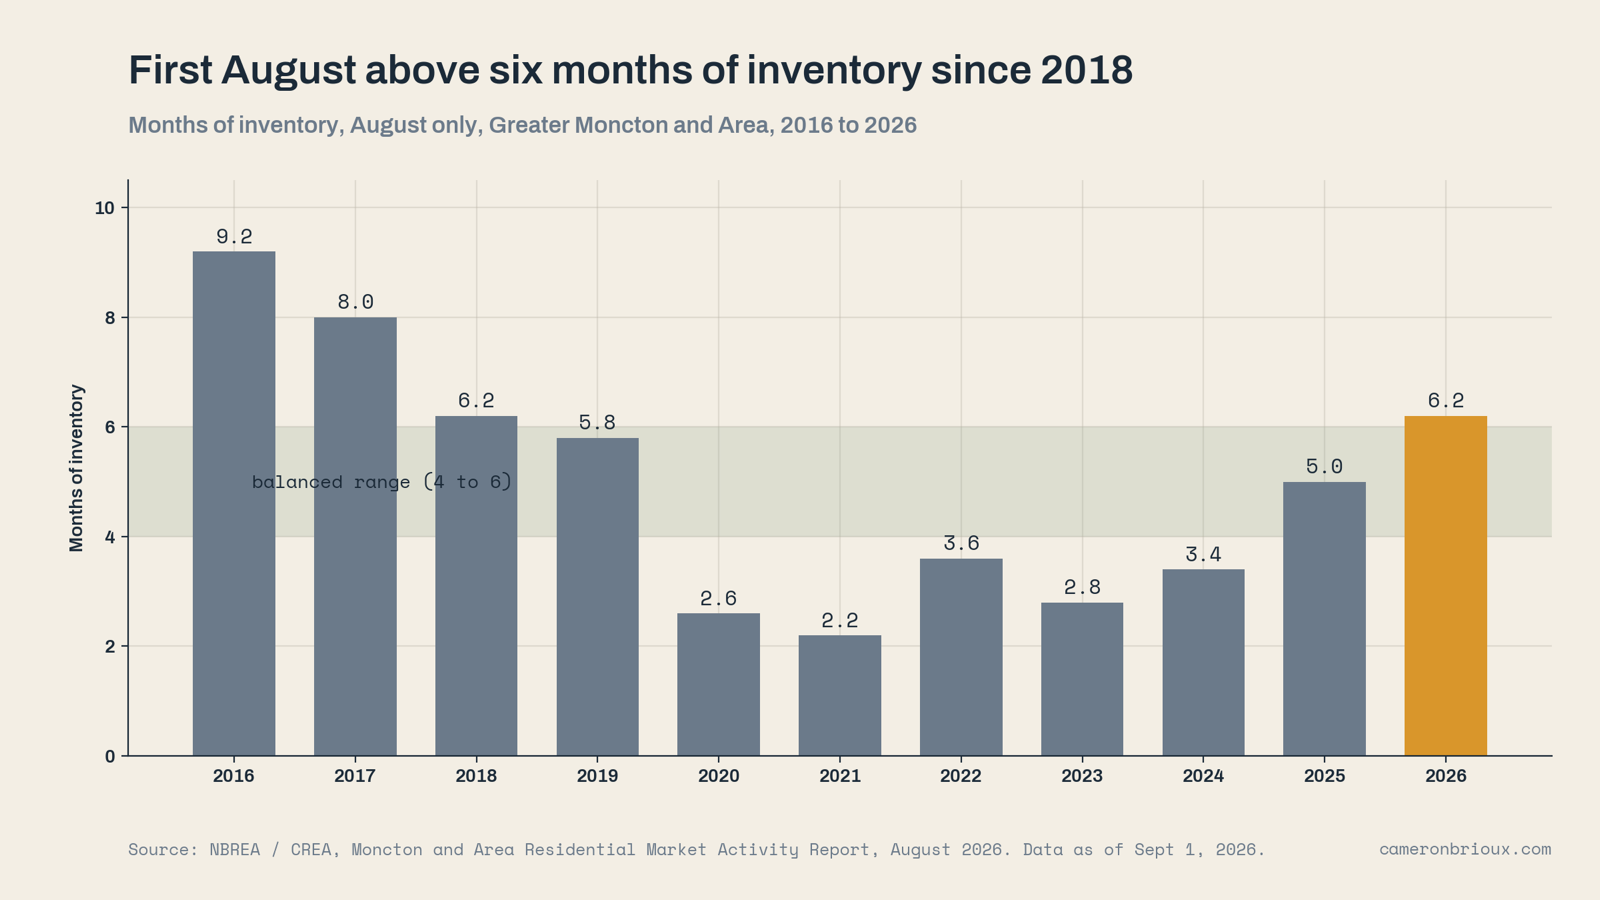
At the same time, 1,585 homes were sitting active at the end of the month. That is the most August inventory we have had since 2019. Put those two together and you get 6.2 months of inventory. A quick reminder that anything over six is buyer's market territory. The last August we were above six was 2018.
So this is real. This is a shift. But here is where most people get it wrong.
The two-price problem
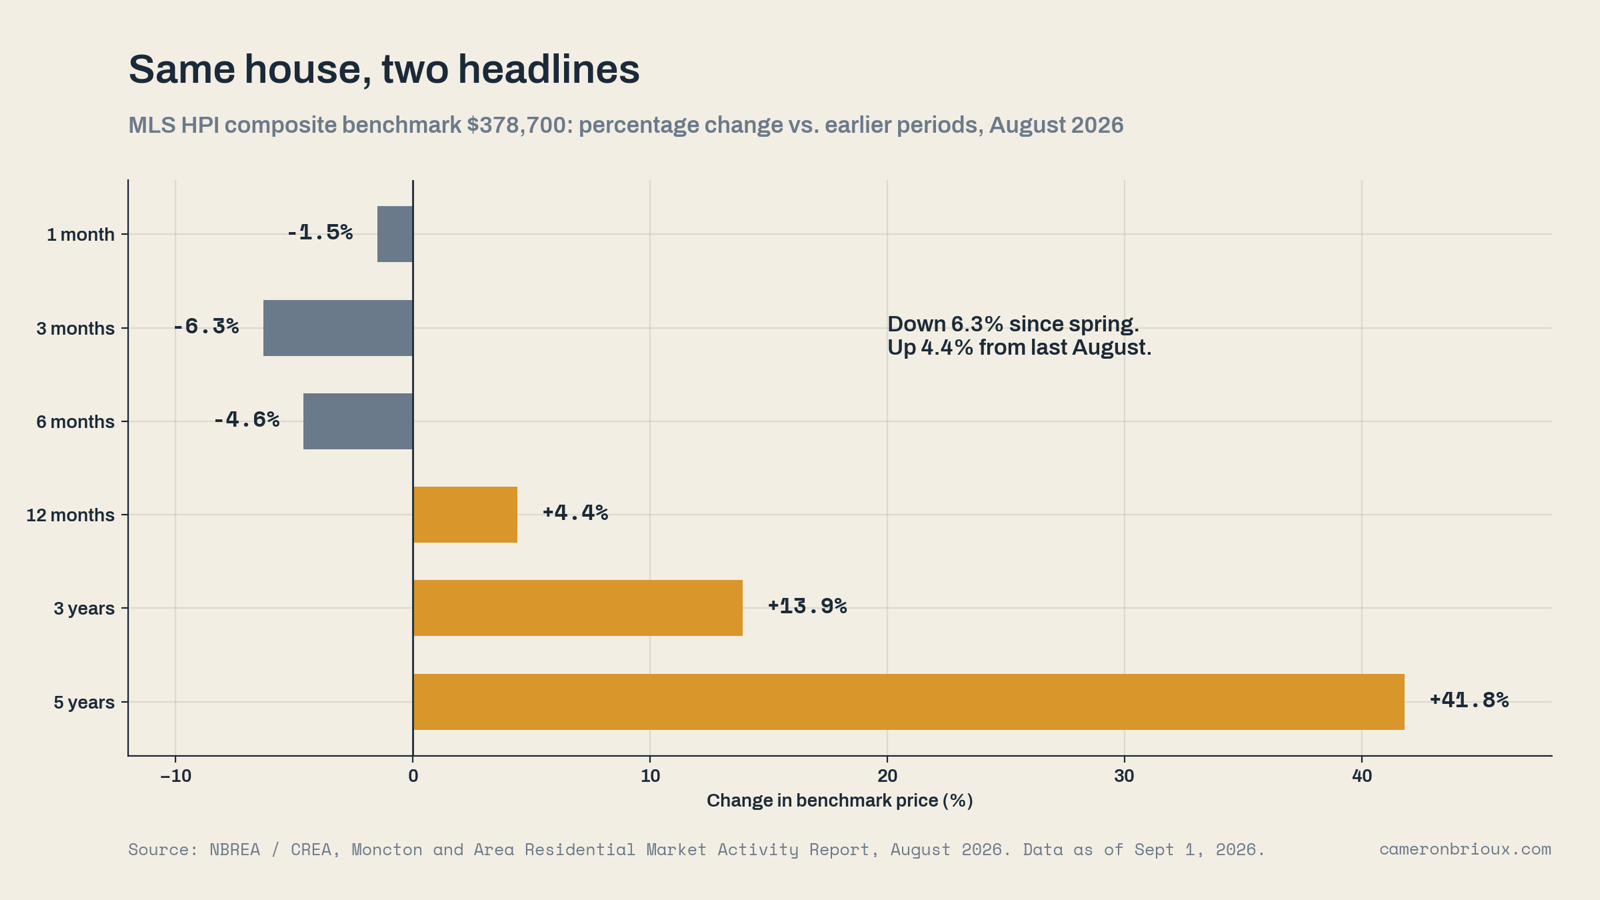
What is confusing right now is that different price stats get thrown around and you might not know which one applies to you. So let me use the cleanest one. The benchmark price, which represents a typical home in Greater Moncton, is $378,700.
Over the last three months, that benchmark dropped 6.3 percent. Over the last twelve months, that same benchmark is up 4.4 percent. Same house. Same index. Two completely different headlines depending on which window you pick.
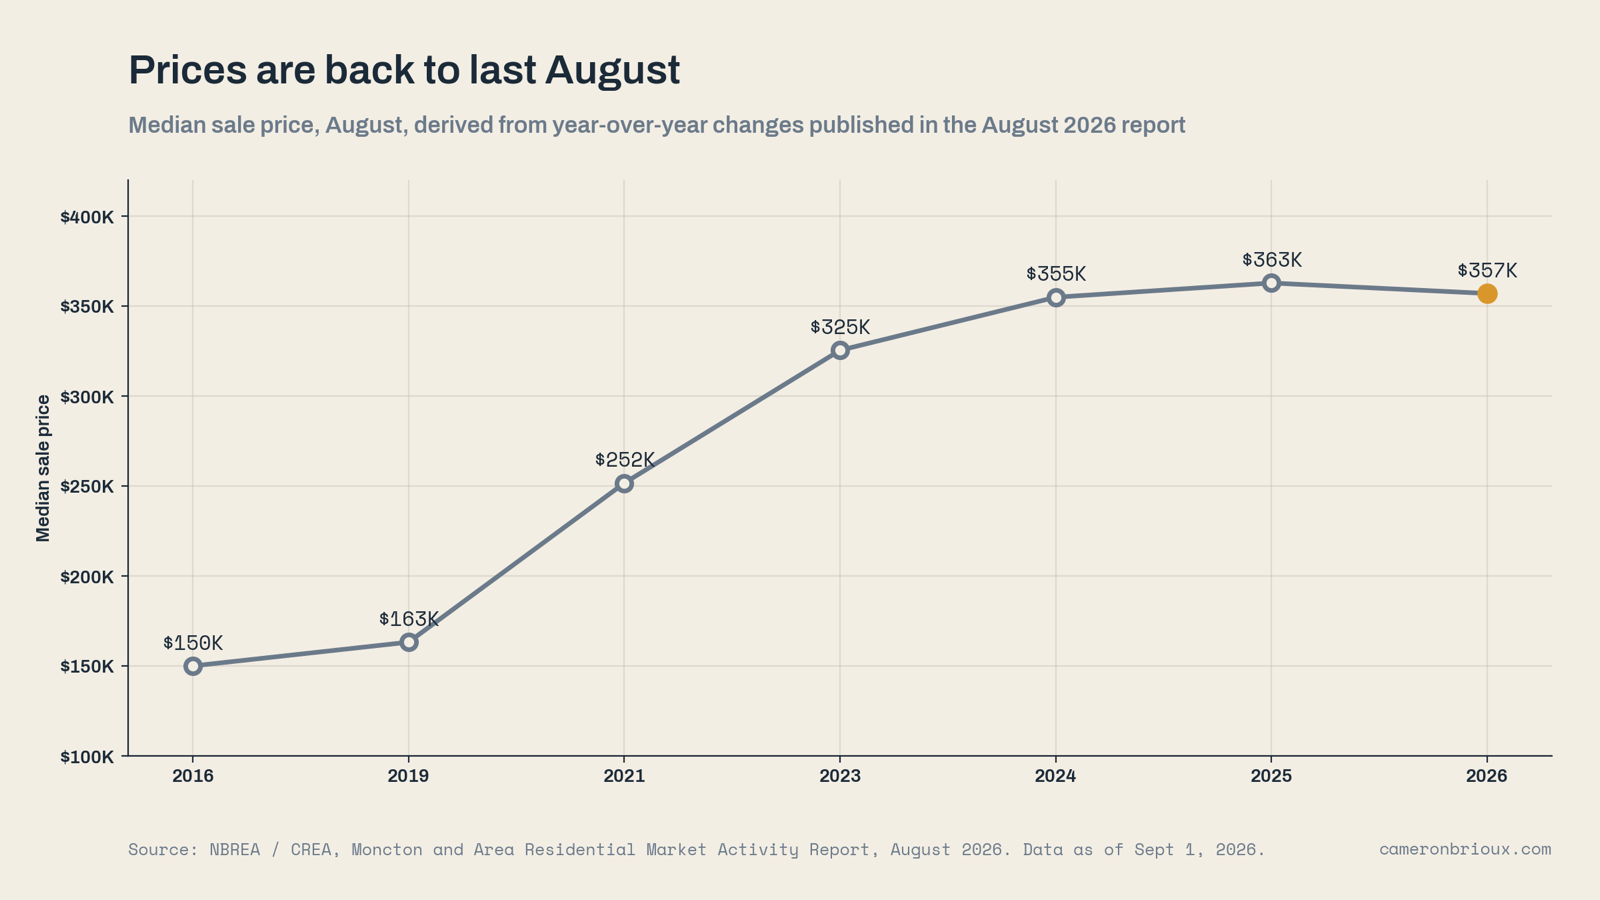
Here is the plain version. Prices ran up in the spring. That run-up has now come off. We are roughly back to where we were a year ago. The median sale price in August was $357,000, down 1.6 percent from last August. The year-to-date median is $361,500, which is flat.
So if you bought at the spring peak, you are down on paper right now. Please do not read that as being in a bad spot. Real estate is a long game. If you bought a year ago, you are about even. If you bought five years ago, the benchmark is still up 42 percent.
Every year there is a layer of price on top of the market from February to May, when buyers are competing and inventory is thin. In 2026 that layer was bigger than usual, and it has now been fully removed. August is what the base market looks like without it.
I call that layer the spring premium. Keep it in mind, because it is the single idea that explains most of what follows.
Where demand went
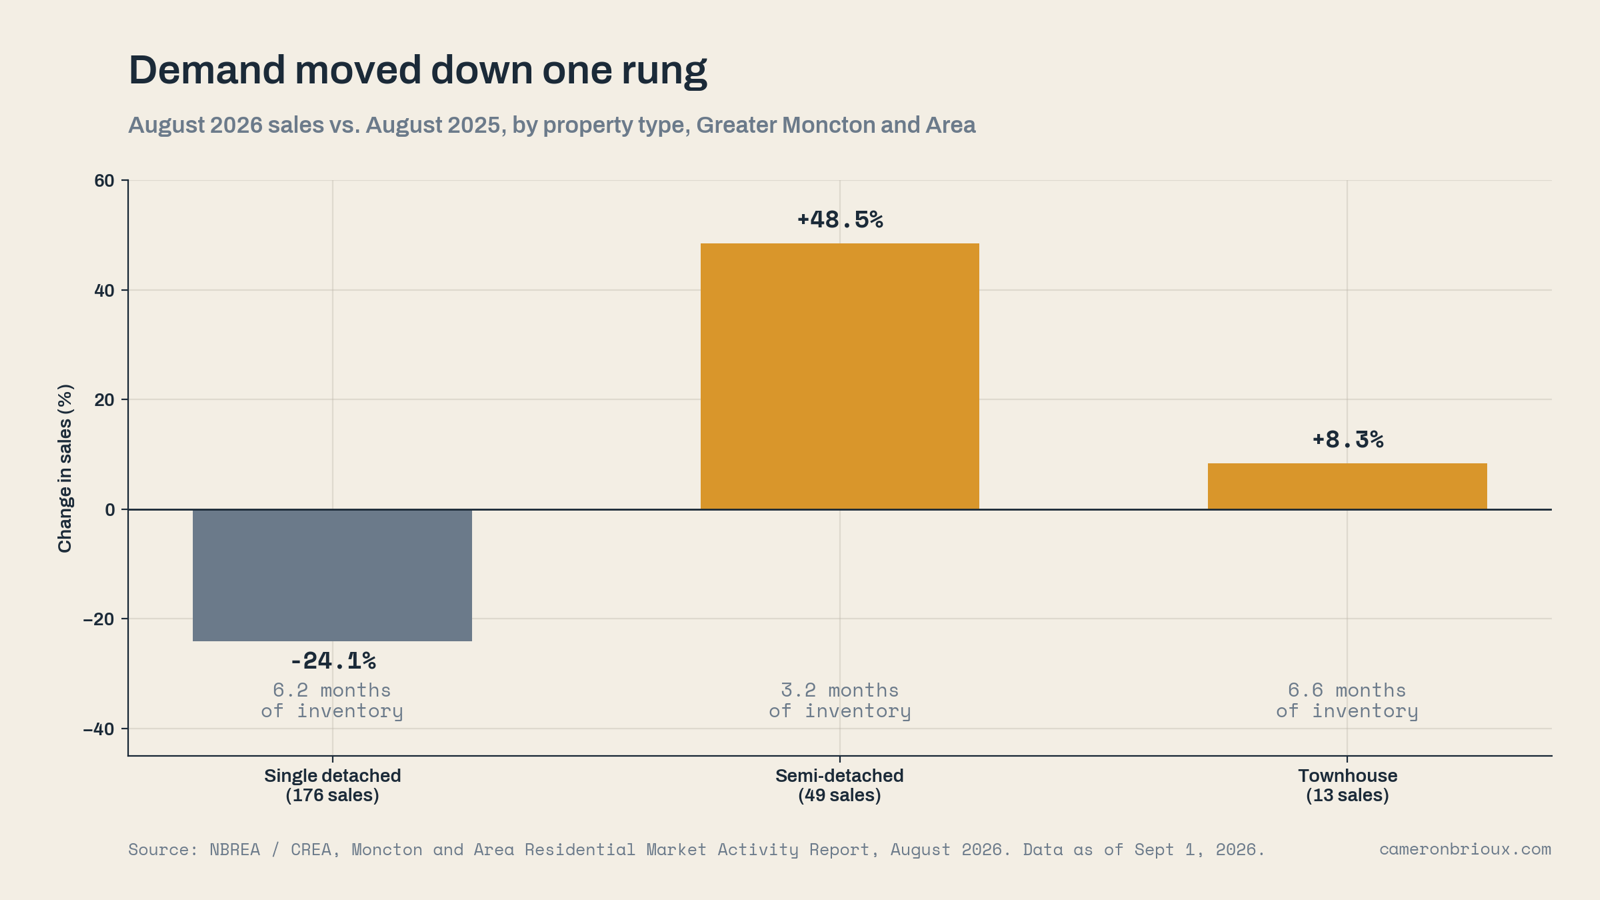
The sales drop was not spread evenly. Single detached sales fell 24 percent. Semi-detached sales rose 48 percent. Townhouse sales rose 8 percent.
Semis had a 94 percent sales-to-new-listings ratio in August. That means almost every semi that came to market got absorbed. Detached homes had 55 percent. Semis are sitting at 3.2 months of inventory. Detached is at 6.2.
So the buyers are still here. They moved down one rung, into the $350,000 to $400,000 attached market, because that is where the monthly payment seems to work. That matters if you are selling a detached home, because you are competing with the largest August inventory in seven years. And it matters if you are buying a semi, because that segment is still tight.
The neighbourhood split
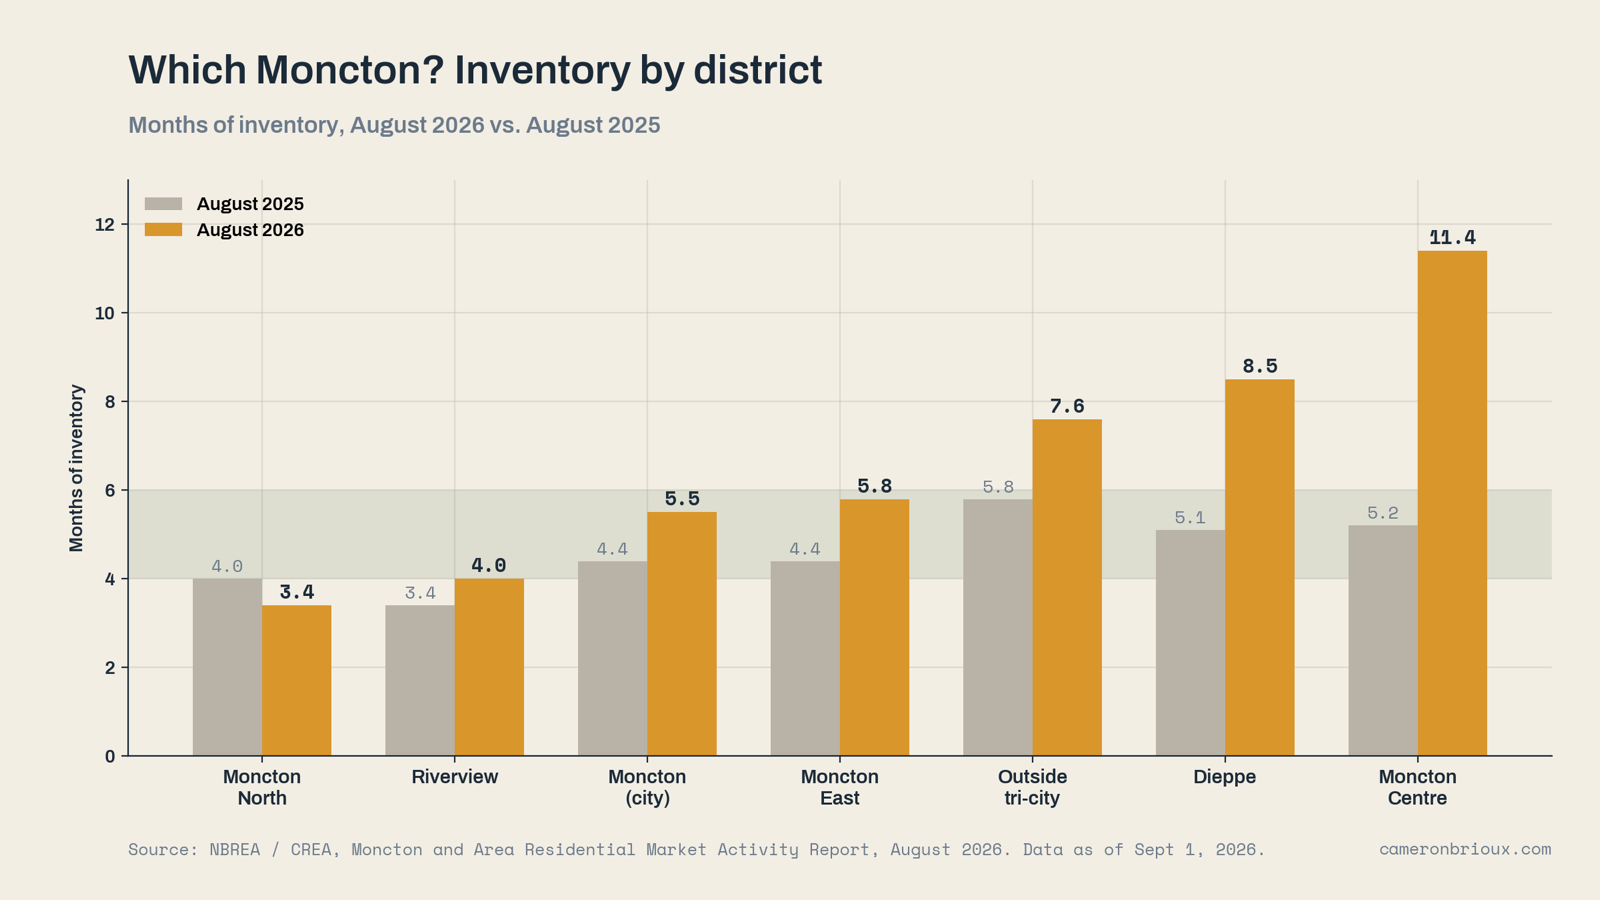
One more layer, because Greater Moncton is not one market.
- Moncton North sold 42 homes in August and only 39 came to market. Sales were up 13 percent. Inventory sits at 3.4 months and it got tighter than last year. It is the only major district in the region that tightened in August.
- Riverview is steady. Active listings are down 19 percent from last year, and inventory is at four months.
- Moncton Centre is the softest spot. 18 sales against 63 new listings. 11.4 months of inventory.
- Dieppe moved from 5.1 months last year to 8.5 this year. New listings up 13 percent, sales down 26 percent. Yes, Dieppe was hot last month. August cooled it fast.
- Outside the tri-city, the rural and coastal areas are at 7.6 months.
So when someone tells you Moncton is a buyer's market, ask them which market they are talking about.
What sellers are actually getting
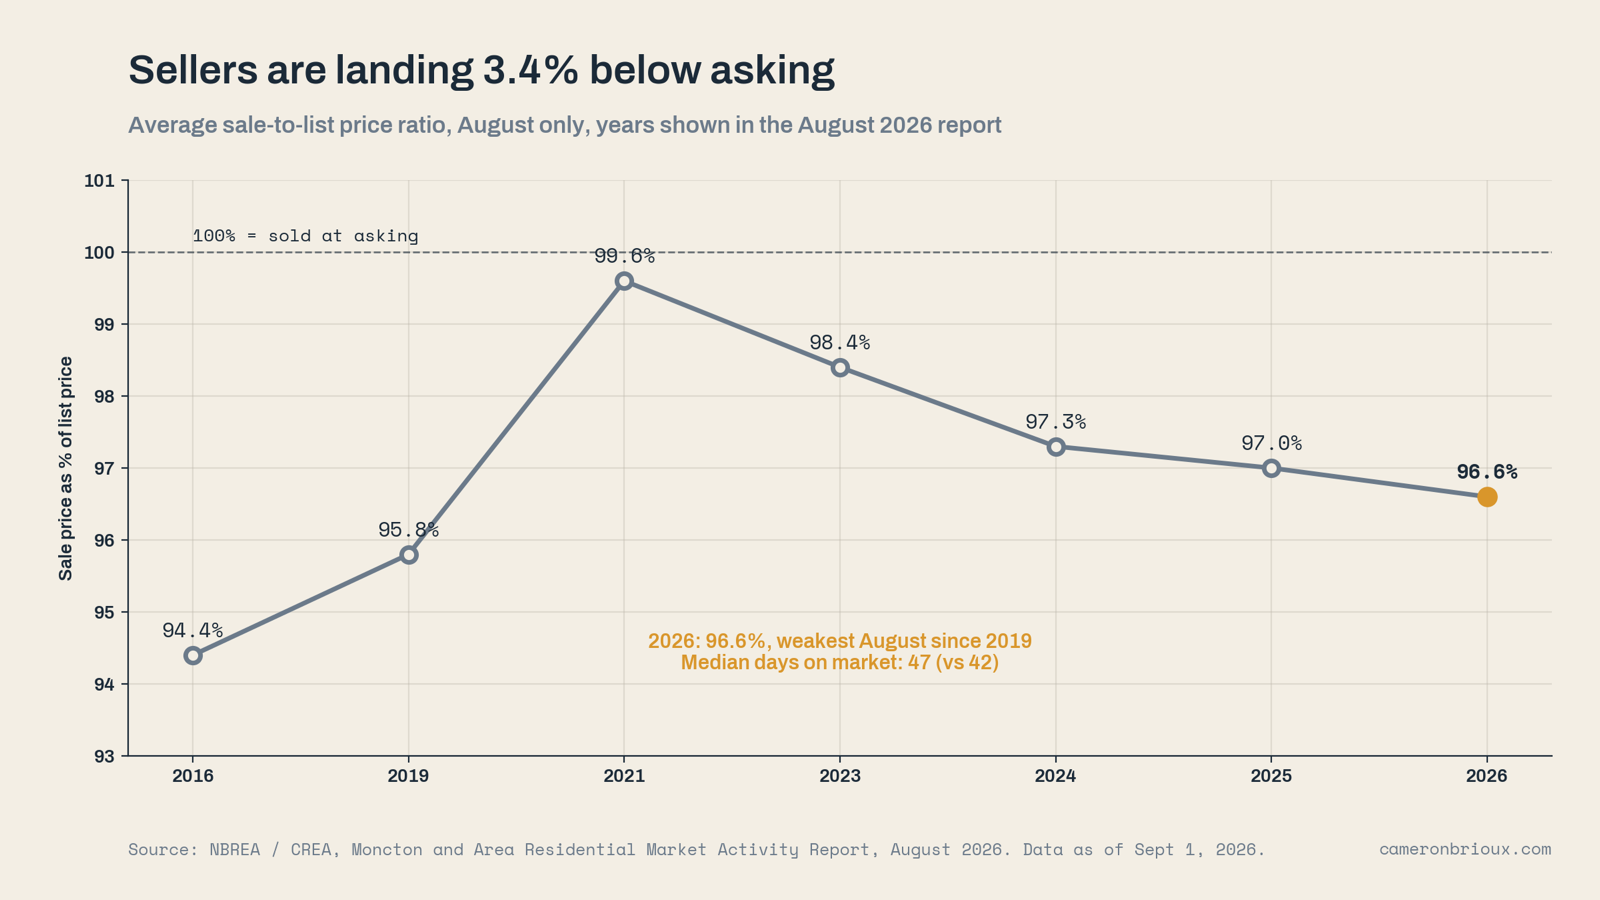
The average home in August sold for 96.6 percent of its list price. That is the weakest August since 2019. On a $375,000 list price, that is about $12,750 off asking. Median days on market is 47. Last August it was 42.
Those two numbers are the honest picture of what it takes to sell right now.
The reframe
The market did not break in August. It reset. The spring premium came off, sales slowed, inventory built, and prices landed almost exactly where they were twelve months ago.
If you think prices are crashing, you are looking at the three-month window. If you think prices are still rising, you are looking at the twelve-month window. Both of you are reading the same chart.
The number that actually tells you what to do is neither of those. It is 6.2 months of inventory, 47 days on market, and 96.6 percent of list. Those three numbers set the terms of every negotiation happening in Greater Moncton right now.
If you are selling
Price to August. Do not price to April. The comparable sales from March and April carry the spring premium. If you list against them, you are listing against a market that no longer exists.
The data says the typical seller who prices to the current market takes about 47 days and lands within three or four percent of asking. The seller who prices to spring sits longer, reduces, and usually ends up below where they would have landed if they had priced correctly on day one.
If you own a detached home in Dieppe or Moncton Centre, you have the most competition in the region. Presentation and pricing both need to be sharp. If you are in Moncton North or Riverview, you have more room, but not spring-level room.
If you are buying
This is the most leverage a buyer has had in Greater Moncton since 2019. Six months of inventory. Forty-seven days on market. Three and a half percent below asking on average. None of that existed a year ago.
And it did not come from cheaper money. Rates have not done the work here. Inventory has.
If you are shopping for a detached home, you can take your time, get an inspection, and negotiate. If you are shopping for a semi or a townhouse, be ready. That segment is still moving.
Price to August. Not to April. ….my call
If I were selling
I would list in September, price to the August comps, and I would expect to negotiate. I would not wait for spring to get the premium back, because I would be carrying the home for six months to chase a layer of price that may or may not return, in a market with the most listings in seven years.
If I were buying
With financing in place, I would be writing offers this fall. I would be shopping for a detached home that has been sitting more than 45 days, and I would be offering below asking with a clean inspection condition.
The last time this much inventory was on the market in August, the next two years were the strongest run this region has ever had. I am not saying that repeats. I am saying the window to negotiate does not stay open forever.
The one number I am watching for September
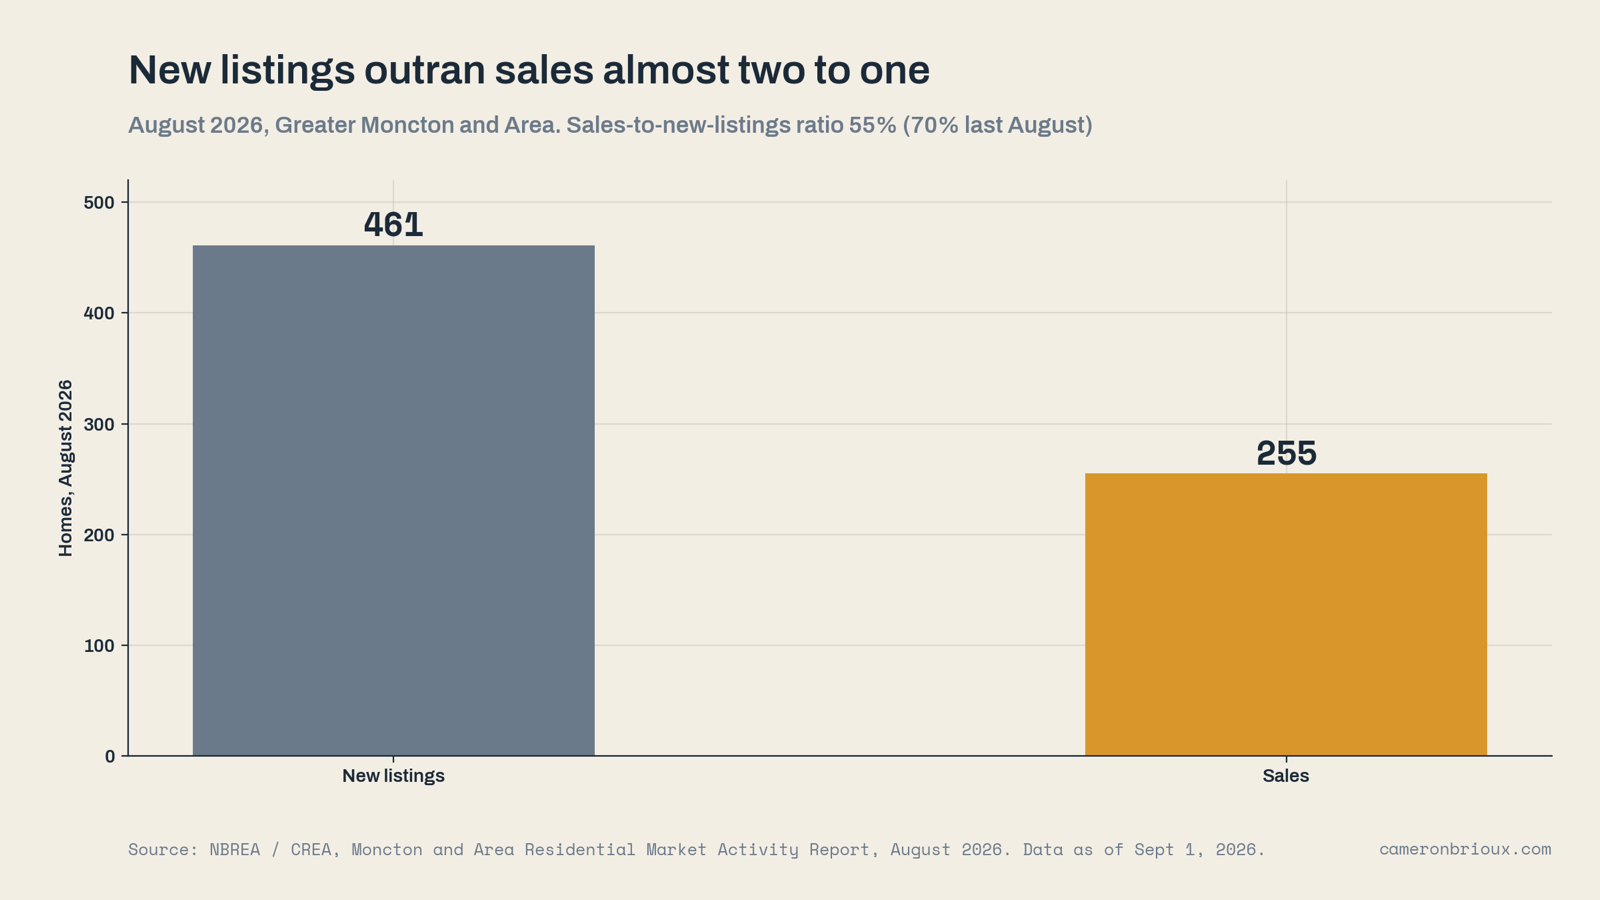
New listings outran sales by almost two to one in August: 461 came to market, 255 sold. If that gap holds, inventory keeps building and the sale-to-list ratio slips further. If new listings pull back, the market stabilizes here. That is the whole question for the fall, and I will have the answer for you in the September update.
Run your numbers against August, not April
If you are trying to figure out which side of this you are on, whether you should be listing now, waiting, or writing offers, that is the conversation I have every day.
Reach out and we will run your numbers against August, not April.
Source: New Brunswick REALTORS® / Canadian Real Estate Association, Moncton and Area Residential Market Activity and MLS® HPI Report, August 2026. All figures as of September 1, 2026. Median price history in Chart 4 is derived from the year-over-year percentage changes published in that report. District and property-type figures are monthly and based on small sample sizes; treat months of inventory and sales-to-new-listings ratios as the reliable signal at that level. Cameron Brioux, REALTOR®, eXp Realty. Greater Moncton, New Brunswick.